

WHO’S TO BLAME? 2016 PRESIDENTIAL ELECTION POLL DATA
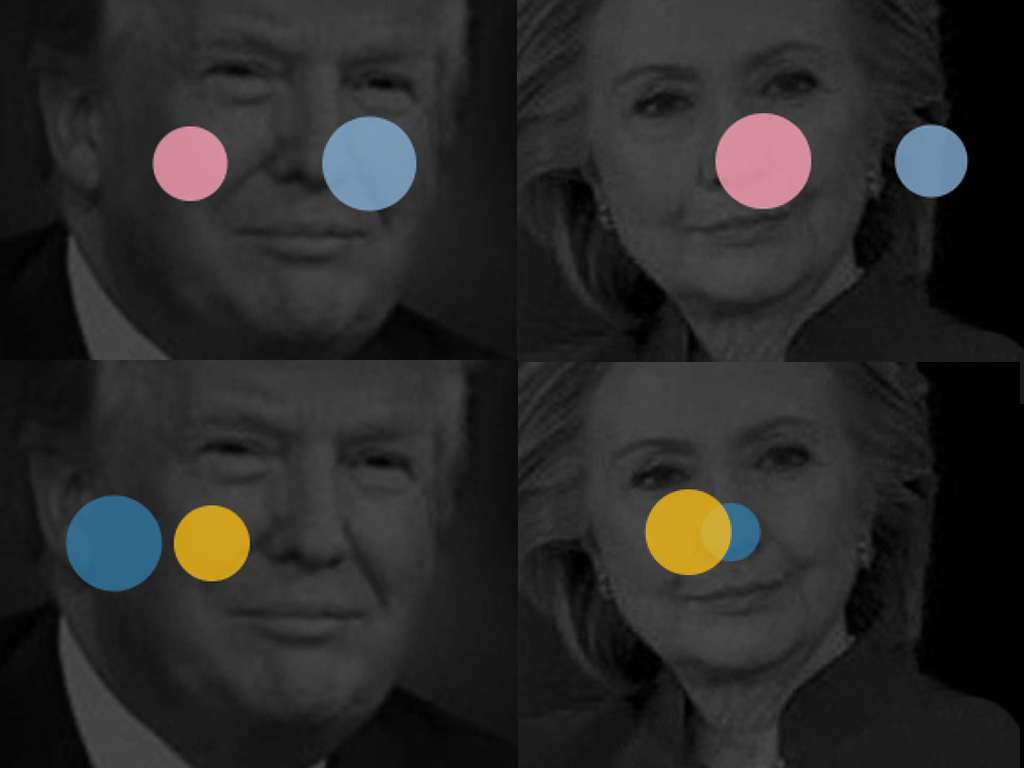
When the results of the 2016 Presidential Election were announced I had many unanswered questions, but the first and most important was, “How did this happen?” I utilized Processing to generate data visualizations that presented the stone-cold facts. These were then created into campaign buttons to be worn by supporters of the Democratic and Republican candidates.
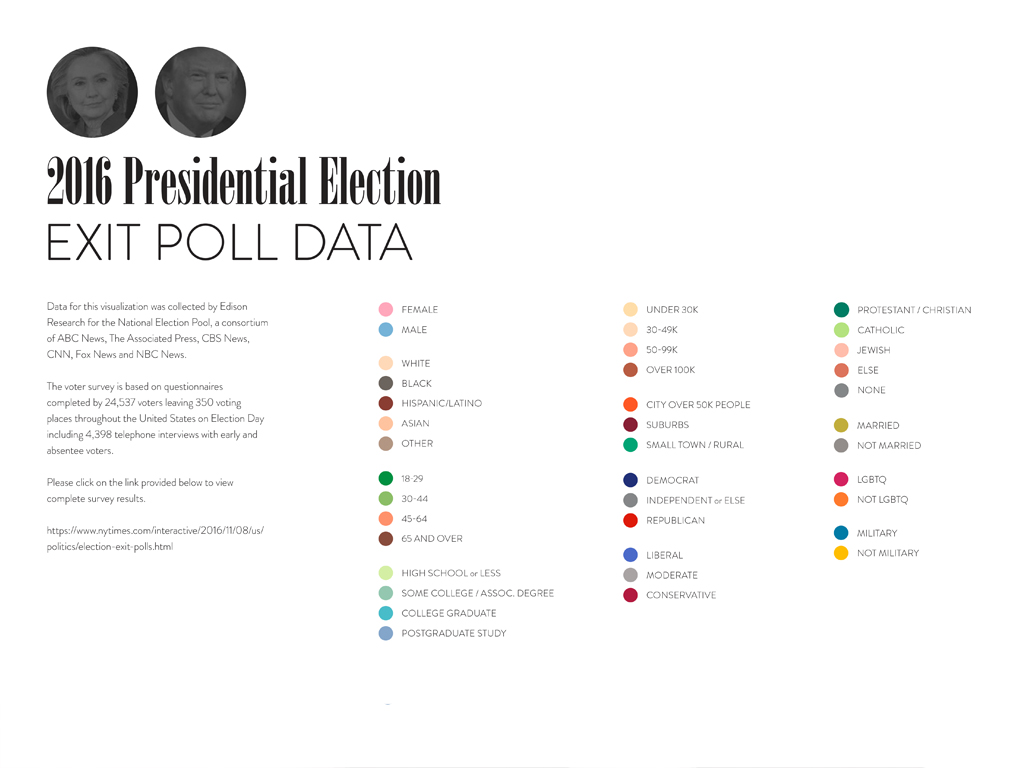
Data for this visualization was collected by Edison Research for the National Election Pool, a consortium of ABC News, The Associated Press, CBS News, CNN, Fox News and NBC News.
The voter survey is based on questionnaires completed by 24,537 voters leaving 350 voting places throughout the United States on Election Day including 4,398 telephone interviews with early and absentee voters.
Please click on the link provided below to view complete survey results.
https://www.nytimes.com/interactive/2016/11/08/us/ politics/election-exit-polls.html